Concept · GeoAI
Resolution in satellite imagery: GSD, revisit time and bands
The numbers that decide whether an image can answer your question, and how to choose between free and commercial data.
Beginner7 min read
Key takeaways
- Spatial resolution (GSD) is the size of one pixel on the ground, and it sets the smallest thing you can see.
- Revisit time is how often a satellite images the same place, and cloud cover reduces it in practice.
- Spectral bands decide what you can tell apart, such as healthy crops from stressed ones.
- Higher resolution is not always better: it costs more and covers less area.
Before you order, download or analyse a single satellite image, check three things about it. They are cheap to check and expensive to ignore. Together they decide whether the data can answer your question at all.
People often ask for “the best resolution available”. That is the wrong question. The right one is: what is the smallest thing I need to see, how often do I need to see it, and what do I need to tell apart? This article walks through each of the three properties and then shows how to match them to a real question.
Spatial resolution: how small a thing can you see?
Spatial resolution is usually described by ground sample distance, or GSD. It is the distance on the ground between the centres of two neighbouring pixels. A GSD of 10 metres means that each pixel covers an area of about 10 by 10 metres. Anything much smaller than a pixel is blended into its surroundings.
- 30 metres: large fields, forests, lakes and the outline of cities. Free archives such as Landsat sit here.
- 10 metres: fields, roads, large buildings and rivers. Sentinel-2, which is free, gives 10 metre pixels in its main bands.
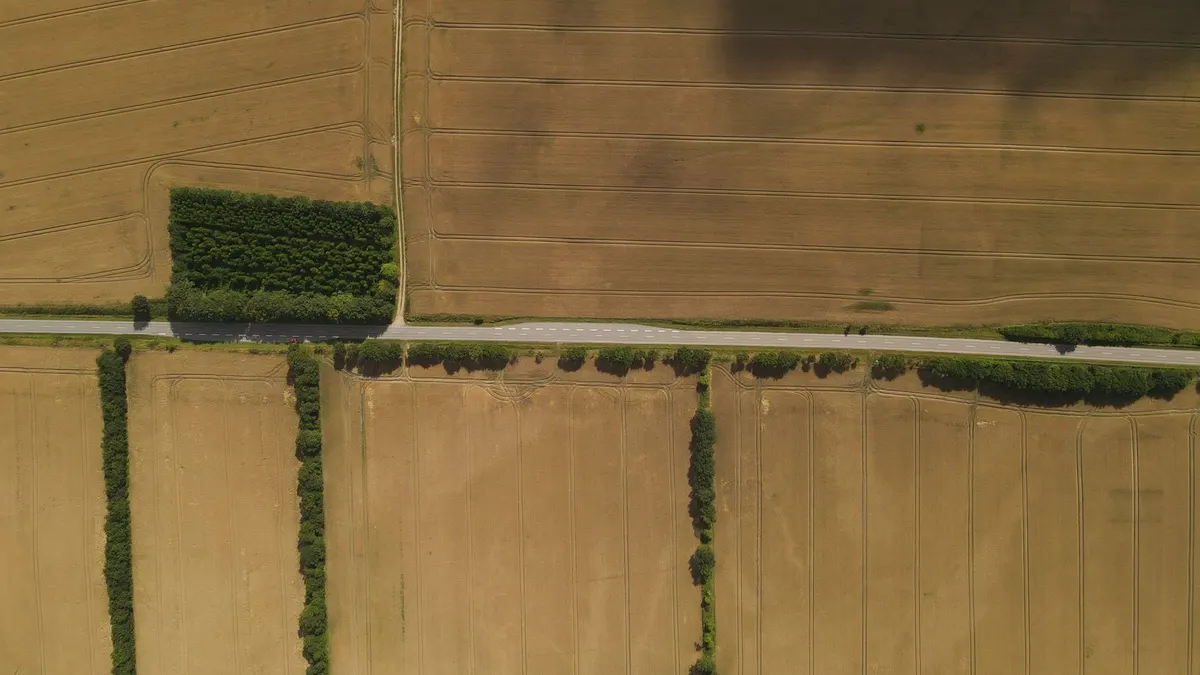
- 3 to 5 metres: small fields, groups of houses and narrow rivers. Commercial constellations offer this, often with frequent images.
- Around 50 centimetres: individual buildings, vehicles and trees. Commercial high-resolution satellites and aerial surveys reach this.
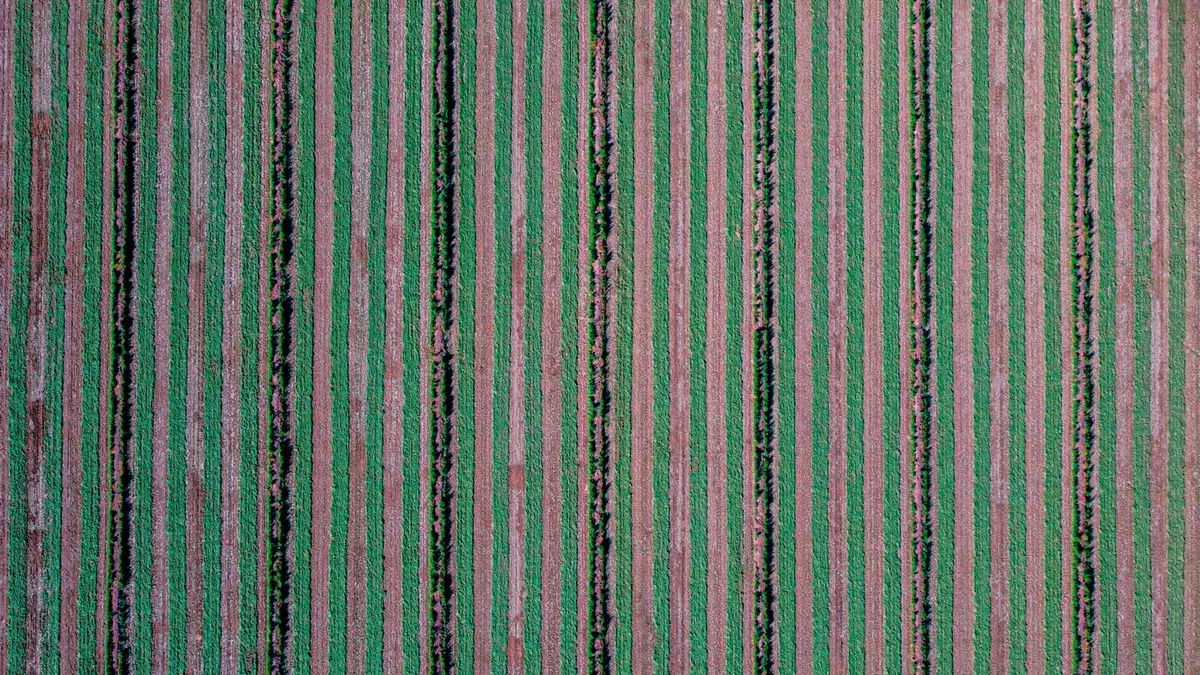
- A few centimetres: cracks, roof tiles and crop rows. Drones are the usual source.
Finer resolution comes with trade-offs. A high-resolution image covers a smaller area, the file is far larger, processing takes longer and, for commercial data, the price rises sharply. Many projects succeed with free 10 metre data because the thing they care about, such as a field, is much bigger than a pixel.
Revisit time: how often can you look?
Revisit time, sometimes called temporal resolution, is how often a satellite images the same place. It matters whenever your question involves change. Following a crop through a season needs images every week or two. Mapping a road network, which changes slowly, may need only one clear image a year.
The number in the brochure is not the number you get. Optical satellites cannot see through cloud, so in a monsoon climate a nominal five-day revisit may deliver only a handful of usable images in a whole season. Plan for far fewer clear scenes than the schedule suggests, and consider radar data when cloud is a constant problem, since radar sees through it.
- Sentinel-2 passes over roughly every five days for most places, and is free.
- Landsat images each place about every one to two weeks at coarser 30 metre detail, with a very long archive.
- Commercial small-satellite constellations can image most of the world almost daily, at a few metres.
- Tasked high-resolution satellites image exactly where and when you order, at a price, and with no guarantee of clear weather.
Spectral bands: what can you tell apart?
A satellite sensor records light in separate bands, each covering a range of wavelengths. A normal photograph has three: red, green and blue. Many satellites add near-infrared, short-wave infrared and several narrow bands in between. Different materials reflect these wavelengths differently, and that difference is what lets software tell them apart.
- Red, green and blue (visible): what the human eye sees. Good for context and for presenting results.
- Near-infrared: healthy leaves reflect a great deal of it. Together with red, it powers vegetation indices such as NDVI.
- Red edge: narrow bands between red and near-infrared that are sensitive to leaf chlorophyll and crop stress.
- Short-wave infrared: sensitive to moisture in soil and plants, and useful for burn scars and for telling snow from cloud.
- Thermal infrared: measures surface temperature, used for heat islands and irrigation studies.
If your question is about crop health, bands beyond red, green and blue matter more than extra sharpness. A blurry image with the right bands can answer it. A beautiful true-colour image often cannot.
Two more properties worth knowing
- Swath and footprint: how wide a strip the satellite sees, which decides how much area one scene covers.
- Radiometric resolution: how finely brightness is recorded, usually in bits. More bits capture subtle differences, such as shades of shallow water or thin haze.
Free versus commercial imagery
Free programmes such as Sentinel and Landsat are excellent for regional monitoring, agriculture, forests and water. They are well documented, consistent over time and cost nothing, which makes them the right starting point for most projects. Commercial imagery earns its price when you need fine detail, such as counting buildings or inspecting infrastructure, or very frequent images of a small area.
A sensible path is to prototype with free data. If the question truly needs finer detail, you can then buy commercial imagery for the one area where it counts, with a much clearer idea of what to order.
Matching imagery to a question
- Is this field growing normally this month? Needs frequent images and near-infrared. 10 metre free data is usually enough.
- Where did the flood spread last night? Needs a quick revisit and ideally radar to see through cloud.
- How many new buildings appeared in this town this year? Needs sub-metre detail on two dates.
- Has this forest shrunk over twenty years? Needs a long, consistent archive. Landsat is built for it.
Common mistakes
- Buying high resolution when a free source would answer the question.
- Ignoring cloud, and ending up with three usable images instead of thirty.
- Comparing images from different sensors or seasons as if they were the same.
- Choosing imagery before writing down the question.
A worked example: choosing imagery for a flood study
Suppose a district office wants to know how far a river flooded last week, and which villages were affected. Walk through the three properties in turn.
- 01Smallest feature: they care about whole villages and large fields, which are tens of metres across. A 10 metre pixel is fine, and sub-metre detail would be wasted.
- 02Frequency and cloud: the flood happened during the monsoon, and optical images will be covered by cloud. Radar, which sees through cloud, is the better choice, and the satellite must have passed over during or just after the event.
- 03What must be told apart: water from land. Radar shows water clearly as dark areas, so a simple threshold, checked against a few places on the ground, may be enough.
The decision took three questions and no budget. A team that began by asking for “the best resolution available” would have spent far more, and might still have received a cloudy image.
Terms you will see in product descriptions
- GSD: ground sample distance, the pixel size on the ground.
- Swath: the width of the strip a satellite images in one pass.
- Off-nadir angle: how far the satellite looked sideways. Large angles distort the image and make buildings lean.
- Level 1 and Level 2: how much processing has been applied. Level 2 data has usually been corrected for the atmosphere and is easier to compare over time.
- Cloud cover percentage: the share of the scene covered by cloud, which tells you how much of it is usable.
- Orthorectified: corrected so that the image lines up with a map, with effects of terrain removed.
Frequently asked questions
- Is free satellite imagery good enough?
- For many tasks, yes. Free 10 to 30 metre imagery supports crop monitoring, forest and water mapping, and regional change detection. It is not suitable for counting individual buildings or vehicles.
- Why does a satellite that passes every five days give me so few images?
- Because clouds hide the ground on many passes, and some scenes are partly cloudy. In wet climates, plan on far fewer clear images than the schedule suggests, or use radar.
- Can I improve resolution with software?
- Super-resolution models can make low-resolution imagery look sharper, and they are useful for visual interpretation. They estimate detail rather than recover it, so treat measurements from enhanced images with care.
- Which bands should I get for crop monitoring?
- At least red and near-infrared, which give you vegetation indices such as NDVI. Red-edge and short-wave infrared bands add information about stress and moisture.
Write the question first, then the smallest feature, the needed frequency and the bands that matter. With those four answers, choosing imagery becomes simple.
Join the conversation
Reactions & comments
Comments are opening soon.
In the meantime, tell us what you think by email at info.istem.lab@gmail.com.