Concept · Applied Maths
The story of the water tank: rates of change, slopes and totals, with no fear of calculus
Calculus is just two questions: how fast is something changing right now, and how much has built up in total? A tank, a tap and a speedometer explain both.
Intermediate7 min read
Key takeaways
- A rate of change tells you how fast something is changing at a moment. On a graph, it is the slope.
- A total adds up many small amounts over time. On a graph, it is the area under a curve.
- The two ideas are opposites: slope turns a total into a rate, and area turns a rate into a total.
- Machine learning, flood forecasting and animation all depend on these ideas, in the form of gradients and sums.
At the edge of a mountain village stands a large water tank, and a young operator named Sunita looks after it. Every day she must answer two questions. The first, asked by the villagers: “How fast is the tank filling or emptying right now?” The second, asked by her supervisor: “How much water came in during the week?”
These two questions are, secretly, the whole of calculus. Sunita has never studied it. She does it every day with a notebook, a clock and a depth gauge.
Question one: how fast, right now?
Sunita notes the water level every hour. At 6 in the morning, it is 100 centimetres. At 7, it is 110. At 8, it is 125. At 9, it is 145. The level is rising, and it is rising faster each hour: 10 centimetres in the first hour, 15 in the second and 20 in the third.
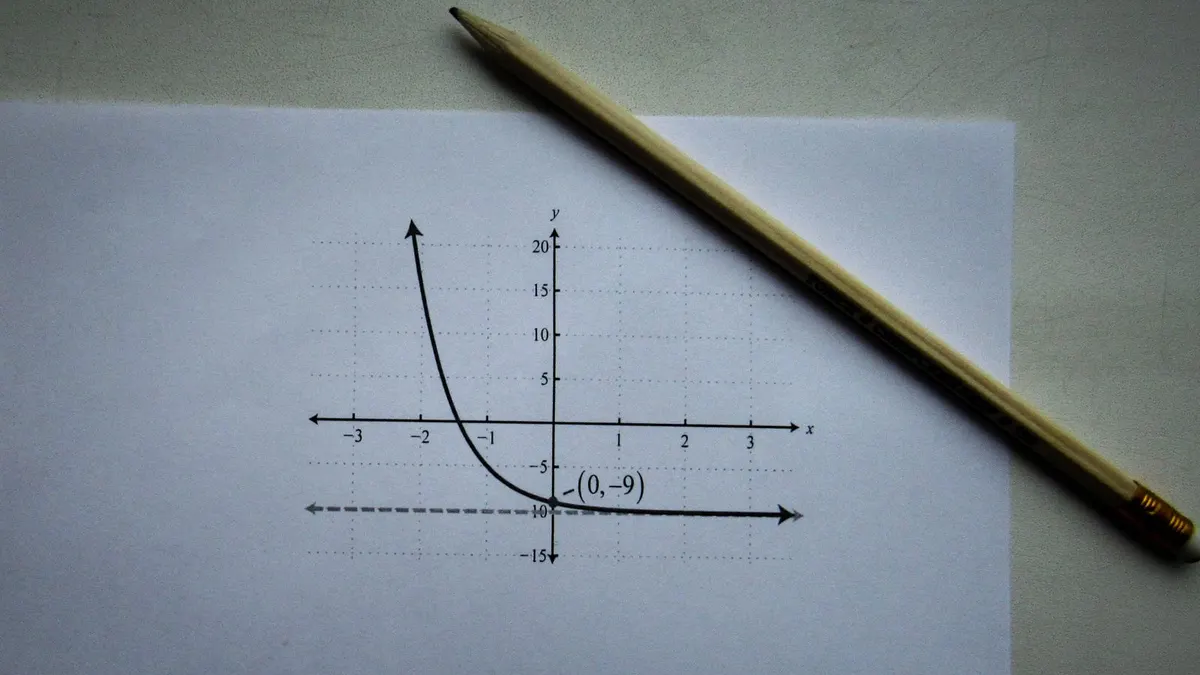
The speed at which the level changes is its rate of change. In the first hour, the rate is 10 centimetres per hour, and in the last it is 20. If she graphs level against time, the line curves upward, and the steepness of the line at any moment is the rate at that moment. Steeper means faster. Flat means no change. Sloping down means draining.
From average speed to instant speed
Think about a car journey. You drive 120 kilometres in 2 hours, so your average speed is 60 kilometres per hour. But your speedometer shows something else: how fast you are going at this very instant. It might read 40 on a hill and 90 on a highway.
The instant speed is what you get if you shrink the time window smaller and smaller. Measure the distance travelled in one hour, then in one minute, then in one second, and the average over that tiny window gets closer and closer to the speed at one instant. That limit is what mathematicians call the derivative. The name is grand. The idea is a speedometer.
Question two: how much in total?
Now the supervisor’s question. Over six hours, the tap fills the tank at different speeds: 5 litres per minute for the first two hours, 8 for the next two and 4 for the last two. How much water came in?
- First two hours: 120 minutes at 5 litres per minute is 600 litres.
- Next two hours: 120 minutes at 8 is 960 litres.
- Last two hours: 120 minutes at 4 is 480 litres.
- Total: 600 plus 960 plus 480 is 2,040 litres.
She multiplied a rate by a time, and added the pieces. If you draw the rate on a graph, with time along the bottom, each piece is a rectangle. The total water is the area of all the rectangles. When the rate changes smoothly, rather than in steps, you simply use thinner and thinner slices. The sum of all the slices is called the integral. Again, the name is grand. The idea is adding up.
The two ideas are opposites
Sunita notices something elegant. If she knows how much water is in the tank at every moment, she can work out the rate by looking at the slope. If she knows the rate at every moment, she can work out the total water by adding up the area. Slope takes you from a total to a rate. Area takes you from a rate to a total. They undo each other, like multiplying and dividing.
This relationship, called the fundamental theorem of calculus, is the reason the whole subject works. It lets engineers move freely between “how fast” and “how much”.
Finding the highest or lowest point
One more trick. When the tank is full and the level stops rising, the slope is flat. If Sunita wanted the exact moment when the daily level peaked, she would look for where the slope changes from rising to falling, passing through zero. Peaks and valleys of any curve are found where the slope is zero. This is how calculus finds the best, biggest or cheapest value of something.
Where this shows up in AI, maps and 3D
- Machine learning: training a model means finding the lowest point of an error curve. The slope tells the computer which direction is downhill, and how steeply. That slope is called the gradient, and the method is gradient descent, which is described in another article in this series.
- Flood forecasting: the rate at which a river’s level rises matters as much as the level, because it tells you how much time you have. The total volume of a flood is the area under the flow curve.
- Rainfall and runoff: adding up rain per hour over a storm gives the total rainfall, and a map of total rainfall is a sum of rates.
- Animation and VR: a character’s position, speed and acceleration are linked by slopes and sums. Smooth motion needs smooth rates.
- Terrain: the slope of the ground, measured from an elevation map, decides where water flows and where landslides may happen. It is a rate of change of height over distance.
- Vegetation monitoring: the rate at which NDVI rises in spring shows how quickly crops are growing.
The formulas behind the story
Sunita’s two questions have two compact formulas. The notation looks grand, but each symbol maps to something in her notebook.
rate = Δlevel ÷ Δtime (derivative: dy/dt = lim Δy ÷ Δt as Δt → 0)
- Δ (delta): a change, new value minus old value
- Δlevel ÷ Δtime: the average rate over a window
- lim as Δt → 0: shrink the window until it is an instant, like a speedometer reading
In the story: from 6 am to 7 am the level rose from 100 to 110 cm, so the rate is (110 − 100) ÷ 1 = 10 cm per hour. From 8 to 9 am it is (145 − 125) ÷ 1 = 20 cm per hour.
total = ∫ r(t) dt ≈ Σ r × Δt
- r: the rate at a moment, here litres per minute
- Δt: the length of each slice of time
- ∫ (the integral): the sum of infinitely thin slices, which is the area under the rate curve
In the story: the tap gave 5 × 120 + 8 × 120 + 4 × 120 = 600 + 960 + 480 = 2,040 litres.
d/dt ∫ r(t) dt = r(t) and slope = 0 at a peak or valley
- The first part says that slope and area undo each other, the fundamental theorem of calculus
- The second part says where to look for the best or worst value of anything
Try it yourself
- 01Record the odometer, or the battery level on your phone, every hour for six hours.
- 02Work out the change each hour, which is the rate. Is it constant, or does it change?
- 03Draw both as graphs. Find the steepest part of the first one.
- 04Add up the rates over the day. Does it match the total change?
Frequently asked questions
- Do I need calculus to use AI?
- Not to use it. But the idea of a slope pointing downhill is what makes training work, so understanding it makes a lot of behaviour less mysterious.
- What is acceleration?
- It is the rate of change of speed. If speed is how fast position changes, acceleration is how fast speed changes.
- What if a curve is jagged and not smooth?
- Computers handle that by working with small steps, which is called numerical calculation. The idea of slope and area remains the same.
- What does negative slope mean?
- That the quantity is falling. A tank that is emptying has a negative rate of change in its level.
Sunita never uses the words derivative or integral. She uses level, rate and total. But in answering her two daily questions, she does what engineers, scientists and machine learning systems do all day: she tracks how fast things change, and how much they add up to. It is one of the most useful ways of thinking ever invented.
Join the conversation
Reactions & comments
Comments are opening soon.
In the meantime, tell us what you think by email at info.istem.lab@gmail.com.