Concept · GIS Basics
GIS basics: rasters, vectors and coordinate systems
The three ideas every beginner needs before opening any GIS software, explained without jargon.
Beginner6 min read
Key takeaways
- Vector data stores shapes (points, lines, polygons). Raster data stores a grid of values, such as pixels.
- A coordinate reference system (CRS) tells software how numbers map to places on Earth.
- Most beginner problems, such as layers that do not line up, come from mixed coordinate systems.
- Choose a projection for the job: one for measuring distances and areas, another for web maps.
When people ask how to get started in GIS, the first advice is nearly always the same: learn the concepts before the software. It is good advice. A few core ideas explain most of what a GIS does, and most of what goes wrong. If you understand them, QGIS, ArcGIS, Python and web maps all become much easier to learn, because they are different tools for the same ideas.
This article covers the three ideas that matter most: the two kinds of spatial data, the coordinate systems that give numbers a place on Earth, and why map projections cause so much trouble.
Two kinds of data: vector and raster
Spatial data comes in two basic forms. Choosing between them is the first decision in almost any project.
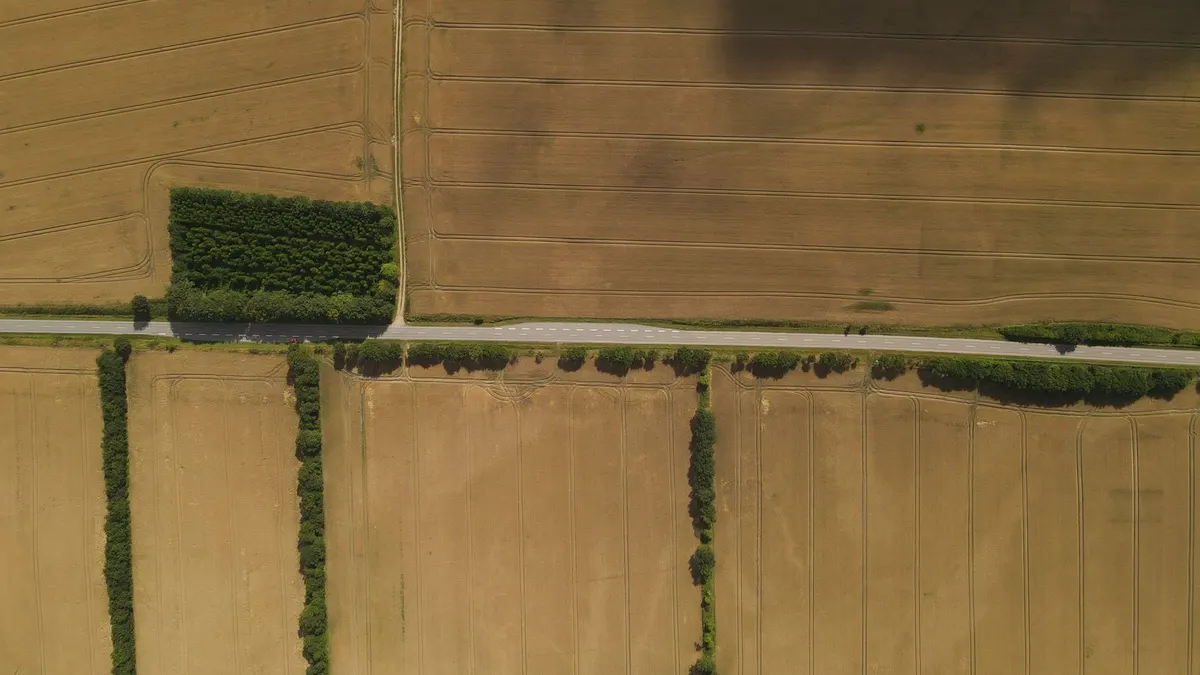
- Vector data describes things as shapes. A point marks a well or a school. A line draws a road or a river. A polygon outlines a field, a lake or a district. Each shape can carry a table of attributes, such as the name, the owner or the population.
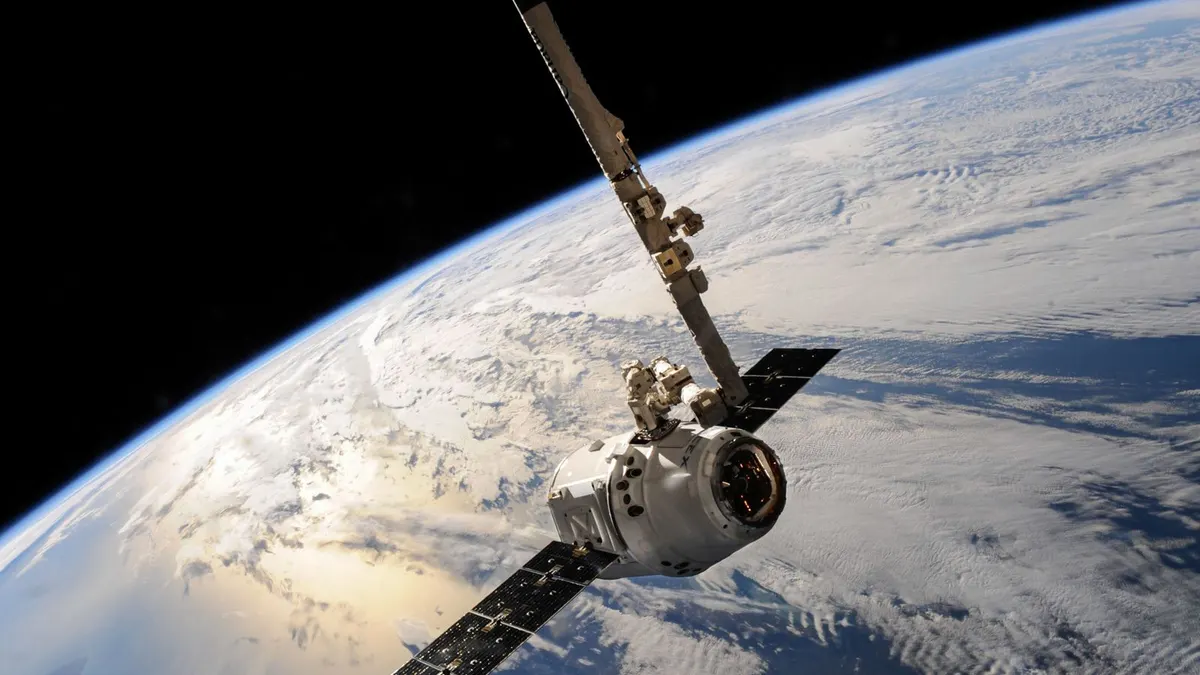
- Raster data describes a surface as a grid of cells, each holding a value. A satellite image is a raster, where each cell is a pixel with a brightness. So is an elevation model, where each cell holds a height, or a rainfall map, where each cell holds an amount.
A useful rule: if you can draw it with a pen as a distinct thing, vector is probably the right choice. If it varies continuously across space, such as temperature, height or colour, raster is the natural choice.
What each is good for
- Vector: boundaries, networks, buildings, anything you want to label, count, measure or search by attribute.
- Raster: imagery, elevation, climate surfaces, and anything you want to analyse cell by cell, for example computing a vegetation index.
- Together: you often combine them, for example summarising a raster’s average value inside each vector polygon, to get the mean elevation of every district.
Why one number is not enough: coordinate reference systems
The Earth is a curved, slightly lumpy ball, and a map is flat. A coordinate reference system, or CRS, is the agreement that says how a pair of numbers maps to a place. Without it, the numbers 27.68 and 85.32 mean nothing. With it, they point at a spot in the Kathmandu valley.
There are two families of CRS you will meet again and again.
- Geographic systems use angles: latitude and longitude, measured in degrees. The best known is WGS 84, used by GPS. It describes positions anywhere on the globe, but degrees are awkward for measuring, because a degree of longitude is a different distance at every latitude.
- Projected systems flatten the globe onto a plane and use metres or feet. They are good for measuring distances and areas over a limited region. UTM zones are a popular example, and many countries define their own national grid.
What a projection does to the world
Flattening a sphere always distorts something. A projection chooses what to preserve and what to sacrifice.
- Some preserve shape, so angles and local outlines look right, but areas grow towards the poles. The projection used by most web maps is like this, which is why Greenland looks as large as Africa.
- Some preserve area, so comparisons of size are fair, but shapes are stretched.
- Some preserve distance in particular directions, which suits specific tasks such as navigation.
The practical lesson is simple. Use a projected system suited to your region when you measure lengths or areas, and use the web map projection for display, because that is what online basemaps expect.
The beginner mistakes this explains
- Layers that do not line up: one is in degrees and another in metres, and the software has not been told to convert, or one has a missing or wrong CRS label.
- Areas that look wrong: you calculated area in a system that distorts it. Reproject first, then measure.
- Data that appears in the ocean off Africa: latitude and longitude were swapped, or a CRS was assumed incorrectly.
- Distances in degrees: a buffer of “1” covers about 111 kilometres in a geographic system, not one metre.
A simple routine for every new project
- 01Choose a projected CRS that suits your area, and use it for all measuring.
- 02Check the CRS of every dataset when you add it, and reproject it if it differs.
- 03Keep the original data untouched, and save reprojected copies.
- 04Record the CRS in your notes, so that you or a colleague can reproduce the result.
Where to practise
Install QGIS, which is free, and load a few open datasets for your own country or city, such as district boundaries, roads and a satellite image. Notice how the software shows each layer’s CRS. Try measuring the same field’s area in a geographic and a projected system and see how the numbers differ. That single experiment teaches more than a chapter of reading.
File formats you will meet
- Shapefile: the long-standing vector format from Esri. It is really a bundle of several files that must stay together, and it has limits on field names and size.
- GeoJSON: a simple text format for vector data, popular on the web. It expects coordinates in longitude and latitude.
- GeoPackage: a modern, single-file format that can hold vector and raster data. It is a good default for new projects.
- GeoTIFF: the standard raster format, a TIFF image that carries its location and coordinate system.
- KML: used by Google Earth, convenient for sharing simple placemarks and routes.
If you have a choice, prefer GeoPackage for vector data and GeoTIFF for raster data. Both are open, reliable and supported almost everywhere.
A first exercise to try
- 01Install QGIS and open a new project.
- 02Add a basemap, and zoom to your city or district.
- 03Download a free boundary layer, such as districts, from a government or open data portal, and add it.
- 04Open its properties and read the coordinate system. Change the project’s coordinate system, and watch the map change shape.
- 05Add a satellite image or an elevation raster for the same area, and check that it lines up with the boundaries.
- 06Use the measure tool in both a geographic and a projected system, and compare the results.
Twenty minutes of this will make the ideas in this article feel real.
Frequently asked questions
- Which software should I learn first?
- QGIS is the usual recommendation. It is free, widely used and well documented, and the skills transfer to other tools.
- Do I need to learn Python for GIS?
- Not to begin. Learn Python when you need to repeat tasks or analyse large datasets, and you will find it much easier once the core concepts are familiar.
- What is the difference between WGS 84 and Web Mercator?
- WGS 84 is a geographic system using latitude and longitude, used by GPS. Web Mercator is a projected system used by most online maps, which distorts area near the poles.
- Why do my layers not line up?
- Almost always because their coordinate systems differ, or one has none defined. Check each layer’s system and reproject if needed.
Once vectors, rasters and coordinate systems feel familiar, everything else in GIS, from analysis to web maps to satellite machine learning, builds on them.
Join the conversation
Reactions & comments
Comments are opening soon.
In the meantime, tell us what you think by email at info.istem.lab@gmail.com.