Concept · Applied Maths
The story of the two rivers: averages, spread and the outlier that changes everything
Why an average can hide a flood, when the median tells the truth and how to describe how spread out a set of numbers is.
Beginner7 min read
Key takeaways
- An average (mean) can be pulled far from what is typical by a few extreme values. The median is more resistant.
- Two sets of data with the same average can behave completely differently, so always look at the spread as well.
- Standard deviation measures typical distance from the average, and range shows the extremes.
- Outliers are either errors to fix or the most important facts in the data. Find out which.
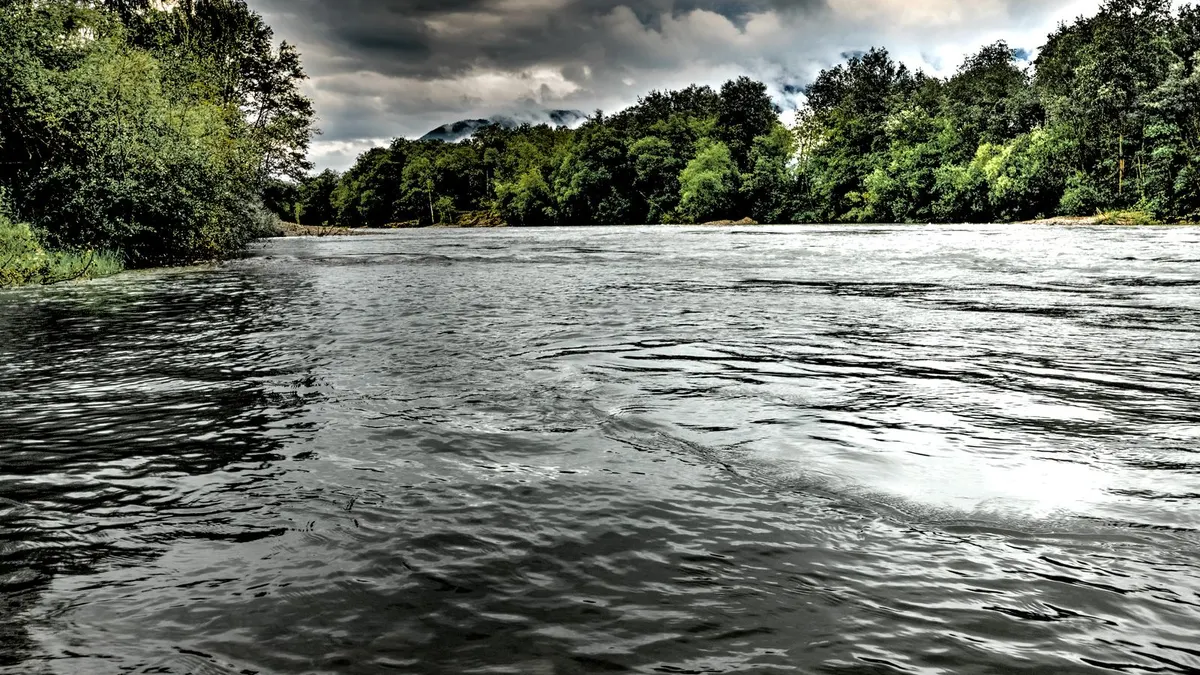
Tashi is an engineer hired to design a bridge across the Sunkhola, a river that runs through a farming valley. He is given a simple fact by the previous team: “The river carries an average of 10 cubic metres of water per second.” That sounds calm, even gentle. It sounds like a river that you could bridge with a modest design.
Tashi, who has worked on rivers before, does not stop at the average. He asks to see the daily records.
Two rivers, one average
To explain his worry, he draws two imaginary rivers. River A flows at exactly 10 cubic metres per second, every single day of the year. River B alternates: one day it trickles at 1, the next day it roars at 19, then trickles again. Add up the flows of river B over two days and you get 20. Divide by two days, and the average is 10.
Both rivers have the same average, and they could not be more different. One is a peaceful stream. The other washes bridges away. The average, taken alone, had told him nothing about the danger.
What the mean is, and what it is not
The mean, or average, is the sum of the values divided by how many there are. It is the balance point of the data, like a see-saw that sits level when the average is placed under the pivot. It is a wonderful summary when values are fairly similar. It is a poor one when a few values are huge.
The village and the millionaire
On his way to the valley, Tashi stops in a village of five households. Their monthly incomes, in the local currency, are 20, 20, 22, 25 and 500 thousand. The last belongs to a family that owns the valley’s only hotel.
Add them up, and you get 587. Divide by five, and the mean is 117.4. “Average income here is 117 thousand,” says a brochure. But four of the five families earn about 20. The brochure’s number describes nobody.
The median fixes this. Put the values in order and pick the middle one: 20, 20, 22, 25, 500. The middle is 22. That is what a typical family earns. The median ignores how extreme the largest value is, so it is the right summary when the data is skewed by a few big numbers.
- Use the mean when values are fairly symmetrical, such as heights of adults, and when you want totals, because mean times count gives the total.
- Use the median when values are skewed, such as incomes, house prices and rainfall in storms.
- The mode is the most common value, useful for categories such as the most popular bus route.
- When mean and median differ a lot, that gap is itself a clue that the data is skewed.
Measuring the wander: spread
Back at his desk, Tashi needs a number for how much the river’s flow wanders from its average. He has two tools.
- Range: the highest value minus the lowest. For river B, that is 19 minus 1, which is 18. For river A, it is zero. Simple, but it depends entirely on two extreme days.
- Standard deviation: roughly, the typical distance of the values from the average. For river A it is zero, and for river B it is 9. A big standard deviation signals an unpredictable river.
A handy rule of thumb for bell-shaped data is that about two thirds of values fall within one standard deviation of the mean, and about 95 percent within two. If a river’s flow is typically 10 with a standard deviation of 9, then flows outside the range of about minus 8 and 28 are very rare. Flows reaching 28 are not something to design around lightly.
The outlier: error or alarm?
In the records, Tashi finds a strange entry: a flow of 480 cubic metres per second on a single day in July, when everything else is below 40. The previous team had quietly deleted it as a mistake.
He does not. He calls the gauge station. The reading is real: a cloudburst upstream caused a flash flood that destroyed two small footbridges. The outlier is not a mistake. It is the most important number in the dataset. His bridge must be designed to survive it.
This is the lesson of outliers. When a value is far from the rest, there are only two possibilities.
- It is an error, such as a faulty sensor, a typo or a decimal in the wrong place. Fix or remove it, and write down why.
- It is real, rare and important. Study it, and design for it.
The worst response is to delete it without finding out which.
Where this shows up in AI, maps and 3D
- Satellite imagery: the average brightness of an image can be thrown off by a few clouds or snow patches. Analysts use the median or mask the outliers first.
- Machine learning: models are sensitive to extreme values, so features are often scaled using the median and spread. Data errors, such as an elevation of 9,999 metres meaning “no data”, can wreck training.
- Quality control: a drone survey’s errors are summarised by an average and a spread, for example “accuracy 3 centimetres, with a standard deviation of 1”.
- VR comfort: the average frame rate may look healthy while rare, long stalls make people feel unwell. The worst frames matter more than the mean.
- Reports: averages of rates, such as the average of district percentages, need weighting by population to be meaningful.
The formulas behind the story
Tashi’s three summaries have exact definitions. Here they are, with the numbers from his valley.
mean = (x₁ + x₂ + … + xₙ) ÷ n
- x₁ … xₙ: the individual values
- n: how many values there are
- Σ is the shorthand for adding them up, so mean = Σx ÷ n
In the story: the village incomes give (20 + 20 + 22 + 25 + 500) ÷ 5 = 587 ÷ 5 = 117.4. The median is the middle value after sorting, which is 22.
standard deviation σ = √( Σ(x − mean)² ÷ n )
- x − mean: how far each value sits from the average
- squaring: makes every distance positive and punishes big gaps
- ÷ n then √: averages the squares and returns to the original units
In the story: river B flows at 1 and 19 with a mean of 10. Each value is 9 away, so σ = √((9² + 9²) ÷ 2) = √81 = 9. River A has every distance equal to 0, so σ = 0.
range = largest − smallest
- Simple, but it depends entirely on the two most extreme values
In the story: river B has a range of 19 − 1 = 18. For bell-shaped data, about 68% of values lie within one σ of the mean, and about 95% within two.
Try it yourself
- 01Write down the prices of ten items you bought recently, including one expensive one.
- 02Calculate the mean and the median. Which describes a normal purchase better?
- 03Remove the expensive one and recalculate. Which number moved more?
- 04Find the range. Does it tell you anything the other numbers do not?
Frequently asked questions
- Which is better, the mean or the median?
- Neither is better in all cases. The mean is right for balanced data and for totals. The median is right for skewed data. Reporting both is often the honest choice.
- What does a standard deviation of zero mean?
- That every value is exactly the same. Real-world data almost never has that.
- How do I decide if a value is an outlier?
- A common rule flags values more than two or three standard deviations from the mean, or far outside the middle half of the data. But the real test is to investigate the cause.
- Should I always remove outliers before analysis?
- No. Remove only those you know to be errors. Real extremes are often the reason you are doing the analysis.
Tashi’s bridge stands high above the flood line. The number that saved it was not the average, but the spread, and the one odd day that someone nearly threw away. When you meet a summary number, ask what it is hiding.
Join the conversation
Reactions & comments
Comments are opening soon.
In the meantime, tell us what you think by email at info.istem.lab@gmail.com.